Ever stared through a microscope at what should be a crisp cellular structure, only to see a blurred smudge? You’re not alone. The culprit isn’t your eyesight or the sample—it’s the resolving power of the microscope, the true gatekeeper of image clarity. While magnification makes things bigger, resolving power makes them visible. It determines how close two points can be and still appear as separate entities. Without sufficient resolving power, even 1000x magnification delivers nothing but a pixelated blur—what scientists call empty magnification.
Understanding resolving power isn’t just for optics experts. Whether you’re studying cell division, identifying pathogens, or analyzing materials, resolution defines what you can actually see. This guide breaks down the science behind resolution, explains how to calculate it, and gives you 7 actionable steps to maximize image clarity. You’ll learn how numerical aperture, light wavelength, immersion oil, and advanced techniques like super-resolution microscopy push the limits of visibility.
What Is Resolving Power and Why It Matters
The Difference Between Seeing Bigger and Seeing Clearly
Resolving power is the microscope’s ability to distinguish two closely spaced objects as distinct. It’s not about size—it’s about separability. A high-resolving-power system reveals fine details like bacterial membranes, nuclear pores, or synaptic clefts. A low one merges them into a single blob.
Think of car headlights at night: far away, they appear as one light; closer, they split into two. The distance at which they first appear separate mirrors the limit of resolution (d)—the smallest resolvable distance between two points.
Resolving power is mathematically the inverse:
Resolving Power = 1 / d
So, a smaller d means higher resolving power. This limit isn’t arbitrary—it’s governed by physics, specifically light diffraction. When light passes through small openings (like a lens), it spreads, forming an Airy disc instead of a sharp point. This wave behavior sets a hard boundary on how much detail visible light can capture.
The Resolution Formula: Abbe and Rayleigh Explained

How Physics Defines What You Can See
The resolution limit of a light microscope is calculated using a formula derived from Abbe’s diffraction theory and the Rayleigh criterion:
$$
d = \frac{0.61 \lambda}{\text{NA}}
$$
Where:
– d = minimum resolvable distance (in nm)
– λ = wavelength of light (nm)
– NA = Numerical Aperture of the objective
This equation shows that resolution improves (smaller d) when:
– Wavelength (λ) decreases
– Numerical Aperture (NA) increases
The 0.61 factor comes from the Rayleigh criterion, which defines when two Airy discs (the diffraction patterns of point sources) are “just resolved”: the center of one aligns with the first dark ring of the other.
An alternative form from Abbe’s original work:
$$
\Delta d = \frac{\lambda}{2n \sin \theta}
$$
Here, $ n \sin \theta $ is the Numerical Aperture (NA), linking lens design and imaging medium to resolution.
Both formulas confirm the same truth: resolution is limited by diffraction, not magnification. No amount of zoom can overcome this physical law.
Numerical Aperture (NA): The #1 Factor in Resolution
Why NA Trumps Magnification Every Time
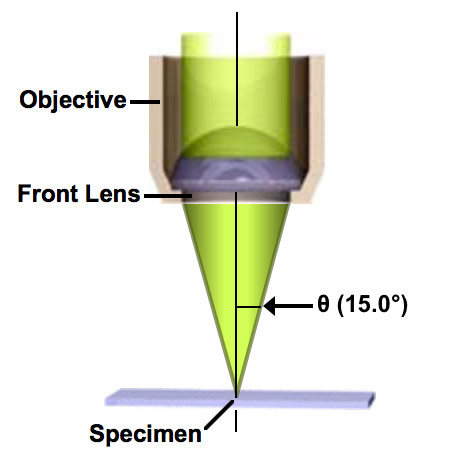
Numerical Aperture (NA) is the single most important factor in resolving power. It measures how much light the objective lens can gather from the specimen. Higher NA = more detail captured.
$$
\text{NA} = n \cdot \sin \theta
$$
Where:
– n = refractive index of the medium (air, oil, water)
– θ = half-angle of the light cone entering the lens
NA by Objective Type:
| Objective Type | NA Range | Resolution Quality |
|---|---|---|
| Low Power (Dry) | 0.1–0.3 | Poor |
| High Power (Dry) | 0.5–0.9 | Moderate |
| Oil Immersion | 1.3–1.4 | Excellent |
A 100x oil immersion objective (NA 1.4) can resolve details down to ~200 nm, while a dry 40x (NA 0.65) maxes out around 500 nm.
How to Maximize NA
- Always use oil immersion for 60x and 100x objectives
- Ensure no air bubbles in the oil layer
- Match condenser NA to objective NA using Köhler illumination
Without high NA, even perfect lighting won’t save resolution.
Wavelength of Light: Shorter = Sharper
Why Blue Light Beats Red for Detail
Resolution improves with shorter wavelengths because they produce smaller diffraction patterns. From the formula $ d \propto \lambda $, halving the wavelength nearly doubles resolution.
Wavelength vs. Resolution (NA = 1.4):
| Light Source | Wavelength (nm) | Resolution (d) |
|---|---|---|
| Red Light | ~650 | ~285 nm |
| Green Light | ~550 | ~240 nm |
| Blue Light | ~450 | ~197 nm |
| Ultraviolet (UV) | ~300 | ~130 nm |
So, blue light resolves finer details than red. This is why fluorescence microscopes often use blue or violet lasers.
But UV light isn’t common in routine labs because:
– It damages live cells
– Requires quartz optics (glass absorbs UV)
– Increases autofluorescence
Electron microscopes take this to the extreme: electrons have wavelengths ~100,000× shorter than visible light, enabling atomic-scale resolution.
Diffraction, Airy Discs, and the Point Spread Function (PSF)
Why Points Don’t Appear as Points
Due to diffraction, a single point source (like a fluorescent dot) appears as a circular blur called the Airy disc, with a bright center and dimmer rings. The size of this disc determines resolution.
Two points are resolved when their Airy discs are separated so that the center of one aligns with the first dark ring of the other—this is the Rayleigh criterion.
Closer than that, and they merge into one blur.
The Point Spread Function (PSF) is the 3D version of the Airy disc. It describes how a point appears in all directions—laterally (x,y) and axially (z). A narrow PSF means high resolution; a wide PSF means blur.
The PSF is used in deconvolution software to computationally remove blur and reconstruct sharper images from 3D stacks.
Practical Resolution Examples
Real-World Calculations
Using $ d = \frac{0.61 \lambda}{\text{NA}} $:
Oil Immersion (Green Light)
- λ = 550 nm, NA = 1.3
- $ d = \frac{0.61 \times 550}{1.3} \approx 258 \text{ nm} $
Dry Objective (Blue Light)
- λ = 450 nm, NA = 0.9
- $ d = \frac{0.61 \times 450}{0.9} \approx 305 \text{ nm} $
Even with shorter wavelength, the lower NA results in worse resolution. This proves: NA dominates over λ.
Max Theoretical Resolution
- λ = 400 nm, NA = 1.4
- $ d = \frac{0.61 \times 400}{1.4} \approx 174 \text{ nm} $
So, ~170–200 nm is the best possible resolution in conventional light microscopy.
7 Factors That Limit Resolving Power
- Wavelength (λ) – Use shorter wavelengths when possible.
- Numerical Aperture (NA) – Maximize with oil immersion.
- Imaging Medium (n) – Air (n=1.0) limits NA; oil (n=1.515) boosts it.
- Optical Aberrations – Use apochromatic objectives to correct chromatic/spherical blur.
- Illumination Alignment – Misaligned Köhler illumination reduces contrast.
- Specimen Thickness – Thick samples scatter light; use thin sections (<10 µm).
- Lens Cleanliness – Dust and oil residue scatter light; clean regularly.
Ignoring any of these degrades resolution—even with a high-NA objective.
Resolving Power vs. Magnifying Power
| Feature | Magnifying Power | Resolving Power |
|---|---|---|
| Purpose | Enlarges image | Separates fine details |
| Dependence | Eyepiece and objective lenses | NA, λ, medium, optics |
| Physical Limit | None (can be infinite) | Diffraction-limited (~200 nm) |
| Empty Magnification | Yes—image bigger but blurrier | No—defines actual detail limit |
Critical insight: Magnification without resolution is useless. A 2000x image with poor NA shows no more detail than a 1000x version—just a larger blur.
How Microscope Types Compare in Resolution
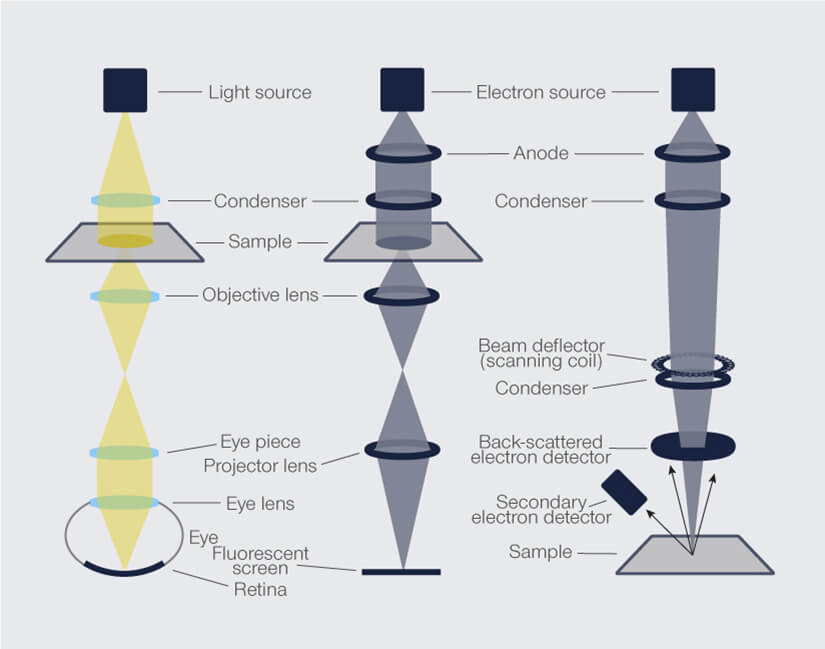
| Microscope Type | Resolution | Notes |
|---|---|---|
| Light Microscope | ~200 nm | Max with oil and blue light |
| Confocal | ~180 nm (xy), ~500 nm (z) | Better contrast via pinhole |
| TEM | ~0.1 nm | Atomic-level imaging |
| STED | ~30–80 nm | Breaks diffraction limit |
| PALM/STORM | ~20–50 nm | Single-molecule localization |
Only super-resolution or electron microscopy can resolve ribosomes (~20 nm) or viruses (~100 nm) clearly.
Super-Resolution: Seeing Beyond the 200 nm Limit
Techniques like STED, PALM/STORM, and SIM bypass the diffraction limit:
– STED uses a donut-shaped laser to shrink the effective PSF.
– PALM/STORM locate single molecules over time.
– SIM uses patterned light to extract hidden details.
These methods, awarded the 2014 Nobel Prize in Chemistry, allow imaging of protein complexes and viral entry in living cells.
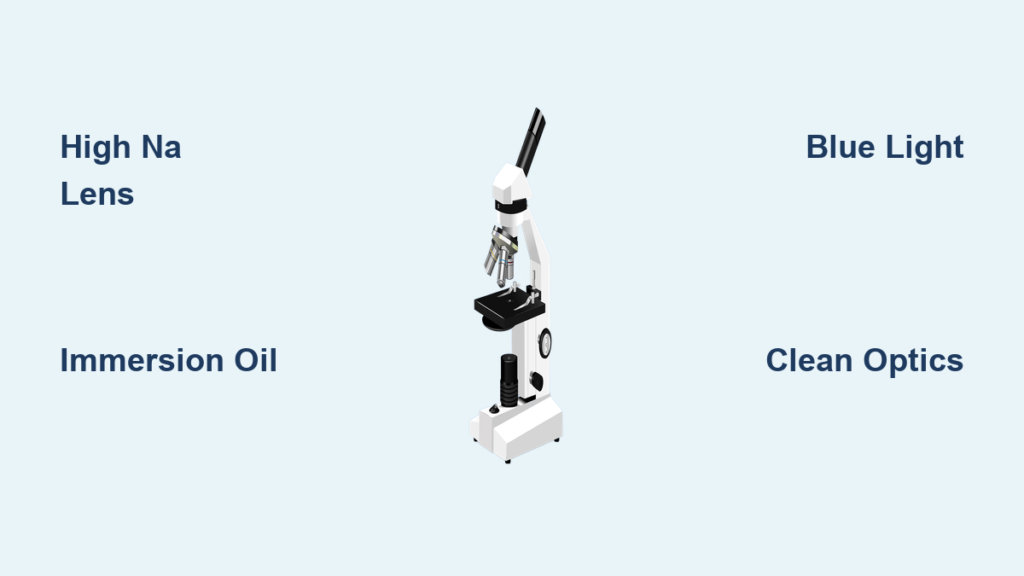
Final Tips: How to Maximize Resolving Power
- Use blue or violet light when possible.
- Choose high-NA oil immersion objectives.
- Apply immersion oil correctly—no bubbles.
- Align Köhler illumination every session.
- Use apochromatic objectives for critical work.
- Keep all optics clean.
- Prepare thin, flat specimens.
For sub-200 nm imaging, consider confocal, deconvolution, or super-resolution methods.
Remember: Magnification enlarges, but resolution reveals. Prioritize resolving power—and see more than ever before.