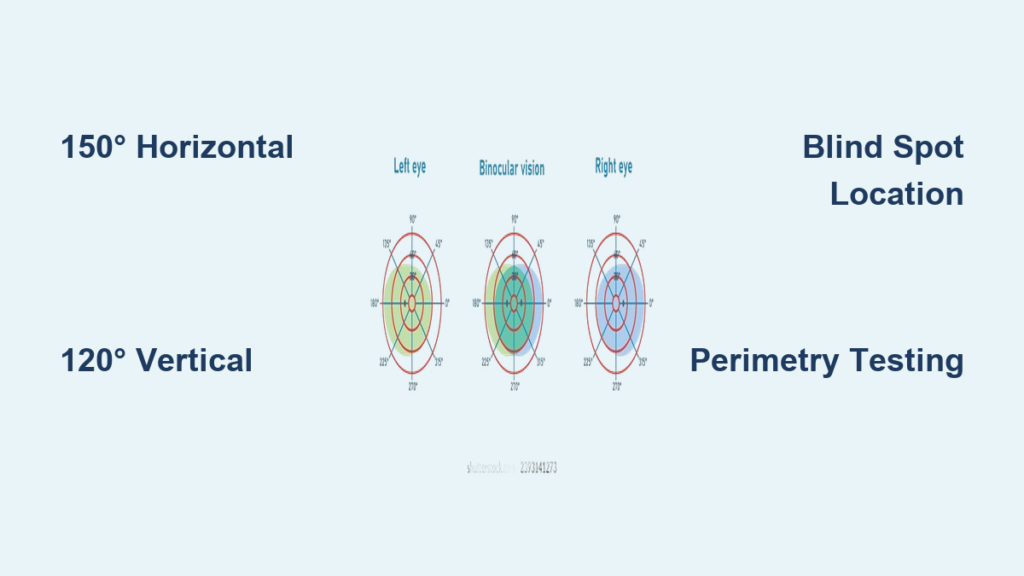
When you fixate your gaze straight ahead, how much of the world can one eye actually see? The answer lies in monocular visual field degrees—a precise measurement of the spatial vision available to a single eye. This field spans well beyond central focus, extending into the periphery where motion detection and environmental awareness are critical. Understanding the normal angular limits of this field—typically 150° horizontally and 120° vertically—is essential for diagnosing eye diseases, assessing neurological conditions, and determining functional capabilities like driving safety.
Clinically, the monocular visual field is mapped using perimetry, a testing method that detects blind spots (scotomas), constriction, or asymmetrical loss. These deviations can signal early glaucoma, retinal degeneration, or brain lesions. This guide breaks down the exact degree ranges in each direction, explains how the physiological blind spot is used in testing, and shows how visual field data translates into real-world function. You’ll learn not only the numbers behind normal vision but also how changes impact health, mobility, and daily performance.
Horizontal Visual Field Coverage

The monocular field isn’t symmetrical—the outer (temporal) side sees much farther than the inner (nasal) side due to facial anatomy.
Temporal Extent: Up to 100°
One eye can detect stimuli up to 100° laterally, toward the temple. Most studies report a range of 90° to 110°, with 100° widely accepted as the standard. This broad lateral reach allows you to notice movement from the corner of your eye—crucial for avoiding obstacles while walking or spotting oncoming traffic when crossing the street.
Nasal Extent: Limited to 60°
Vision inward is restricted to about 50° to 60°, with 60° as the typical benchmark. The nasal bridge physically blocks further visibility, making this the narrowest boundary. In some individuals with prominent facial features, nasal field may be slightly reduced.
Total Horizontal Span: 150°
Combined, the monocular field covers approximately 150° horizontally—100° temporal + 60° nasal. While some sources cite up to 160° under ideal conditions, 150° is the clinical standard used in perimetry and driver licensing evaluations.
Pro Tip: Many countries require at least 120° of continuous horizontal field for legal driving, often assessed binocularly. Even if one eye has full function, significant monocular loss can impair hazard detection and reaction time.
Vertical Visual Field Dimensions
Though narrower than the horizontal span, vertical coverage remains extensive, enabling awareness of overhead signs, floor-level obstacles, and facial expressions.
Superior Field: 60° Upward
Vision extends 60° to 70° above the horizontal meridian. The upper limit is constrained by the brow ridge and orbital bone. The 60° value is most commonly used in clinical documentation and automated perimetry protocols.
Inferior Field: 70° Downward
The lower field reaches 60° to 80° below fixation, with 70°–75° frequently reported. Because there’s less bony obstruction downward (unlike the brow), the inferior field is slightly wider than the superior.
Total Vertical Span: 120° to 130°
Together, the vertical monocular field covers about 120° to 130°, with 120° serving as the standard reference in diagnostic testing.
| Direction | Degrees |
|---|---|
| Temporal | 100° |
| Nasal | 60° |
| Superior | 60° |
| Inferior | 70° |
| Total Horizontal | ~150° |
| Total Vertical | ~120° |
These benchmarks form the foundation for detecting visual field loss in glaucoma, stroke, and retinal disease.
Locate the Physiological Blind Spot
Every healthy eye has a natural blind spot—the optic disc—where retinal nerves exit and blood vessels enter, creating an area without photoreceptors.
Position: 15° Temporal, 1.5° Below
The blind spot lies 15° to the right (right eye) or 15° to the left (left eye) from fixation, and about 1.5° below the horizontal line of sight. It’s an absolute scotoma: no light, color, or movement can be perceived within it.
Size: 7.5° Vertically, 5.5° Horizontally
The average blind spot measures 7.5° tall and 5.5° wide. At a distance of 1 meter on a tangent screen, this corresponds to roughly 7.5 mm vertically and 5.5 mm horizontally.
Why It Matters in Testing
During perimetry, the blind spot serves as a built-in control:
– A shifted or enlarged blind spot may indicate optic disc swelling (e.g., papilledema).
– Failure to detect stimuli here confirms fixation stability.
– Abnormal perception within the blind spot could suggest malingering or unreliable responses.
You can map your own blind spot by closing one eye, focusing on a fixed point, and slowly bringing a small object (like a pen tip) into view from the side—watch it disappear momentarily as it enters the blind zone.
Traquair’s Island of Vision Model

H.M. Traquair famously described the visual field as an “island of vision in a sea of blindness.” This metaphor helps visualize how sensitivity changes across the field.
Fovea: The Peak of the Island
At the center sits the fovea, representing the highest point of the island. This region delivers maximum visual acuity and sensitivity to fine detail and color.
Peripheral Slopes: Declining Sensitivity
As you move away from the fovea, the island slopes downward, reflecting reduced sensitivity to dim lights, small objects, and subtle contrasts. Peripheral vision excels at detecting motion but not detail.
Blind Spot: The Bottomless Pit
Embedded in the temporal slope is a deep pit—the blind spot. Though invisible in daily life due to binocular compensation, it becomes apparent during monocular testing.
Isopters: Contours of Equal Sensitivity
In perimetry, isopters are lines connecting points where a specific stimulus is just visible. Larger, brighter targets produce broader isopters, outlining a wider “shoreline” of the island.
- Concentric contraction means all isopters shrink inward—a hallmark of advanced glaucoma or retinitis pigmentosa.
- Localized notching suggests focal nerve damage, often seen in early glaucoma.
How Visual Fields Are Measured
Accurate assessment of monocular visual field degrees relies on standardized testing methods known collectively as perimetry.
Kinetic Perimetry: Moving Targets
In kinetic testing, a stimulus moves from non-seeing to seeing areas to map threshold boundaries.
Goldmann Perimeter: Gold Standard
- Uses a white bowl with variable-sized and brightened targets.
- Plots isopters manually along multiple meridians.
- Provides a comprehensive map of the full 150° field.
- Ideal for detecting irregular defects and monitoring progression.
Tangent Screen (Bjerrum): Central 30° Only
- A flat black screen with marked concentric rings (5°, 10°, 20°, 30°).
- Tests the central 30°, crucial for reading and face recognition.
- Often used to confirm neurological field defects like altitudinal loss.
Confrontation Testing: Quick Screening
- Performed at bedside; examiner compares patient’s field to their own.
- Patient fixates while fingers or wiggling fingers enter quadrants.
- Fast but insensitive—only detects large defects.
Warning: Never rely solely on confrontation testing for diagnosis. It misses early or partial field loss.
Static Perimetry: Fixed-Point Thresholds
Static perimetry presents stationary lights at set locations and determines the dimmest detectable intensity.
Humphrey Field Analyzer (HFA): Industry Standard
- Fully automated device using SITA algorithm.
- Measures sensitivity in decibels (dB)—higher numbers mean better vision.
- Common test patterns:
- 24-2: Central 24°, 6° spacing—used for glaucoma.
- 30-2: Covers 30°.
- 10-2: Dense grid in central 10°—ideal for macular diseases.
Stimulus Specifications
- Size III (0.43°): Standard for most adults.
- Size V (2°): Used in poor acuity.
- Luminance: From 0.08 to 10,000 apostilbs, attenuated in dB steps.
Esterman Test: Functional Vision for Driving
- Binocular, suprathreshold test with 120 points.
- Uses 10 dB intensity across over 130°.
- Assesses real-world performance, allowing binocular summation.
- Required for driver licensing in many regions.
Interpreting Humphrey Visual Field Reports
Automated perimeters generate detailed printouts that must be read correctly to identify pathology.
Sensitivity Plot: Raw Threshold Data
Each dot shows the dB value at which a stimulus was detected. Normal values are typically 28–32 dB centrally, decreasing slightly peripherally.
Grayscale Map: Visual Overview
Dark patches = reduced sensitivity. Useful for quick interpretation but can be misleading without context.
Total Deviation Map: Compared to Normals
Shows how each point differs from age-matched controls. Negative values = worse than normal.
Pattern Deviation Map: Spotting Localized Loss
Adjusts for overall dimming (e.g., cataracts) to highlight focal defects like arcuate scotomas.
Glaucoma Hemifield Test (GHT)
Compares upper and lower halves. An abnormal result suggests glaucomatous damage.
Key Global Indices
| Index | Meaning | Normal Range |
|---|---|---|
| Mean Deviation (MD) | Average loss across field | > –2 dB |
| Pattern Standard Deviation (PSD) | Focal defect severity | < 2 dB |
| Corrected PSD (CPSD) | Adjusted for variability | Low = stable |
Red Flag: MD worse than –6 dB or PSD > 4 dB suggests significant visual field loss.
Clinical Significance of Field Loss
Abnormalities in monocular visual field degrees help localize damage along the visual pathway.
Optic Nerve Damage
- Glaucoma: Arcuate scotomas, nasal steps, paracentral defects.
- Optic Neuritis: Central or cecocentral scotoma, often with pain on eye movement.
- Ischemic Optic Neuropathy: Altitudinal loss (superior or inferior half).
Retinal Disease
- Retinitis Pigmentosa: Ring scotoma progressing to tunnel vision.
- Macular Degeneration: Central scotoma with preserved peripheral vision.
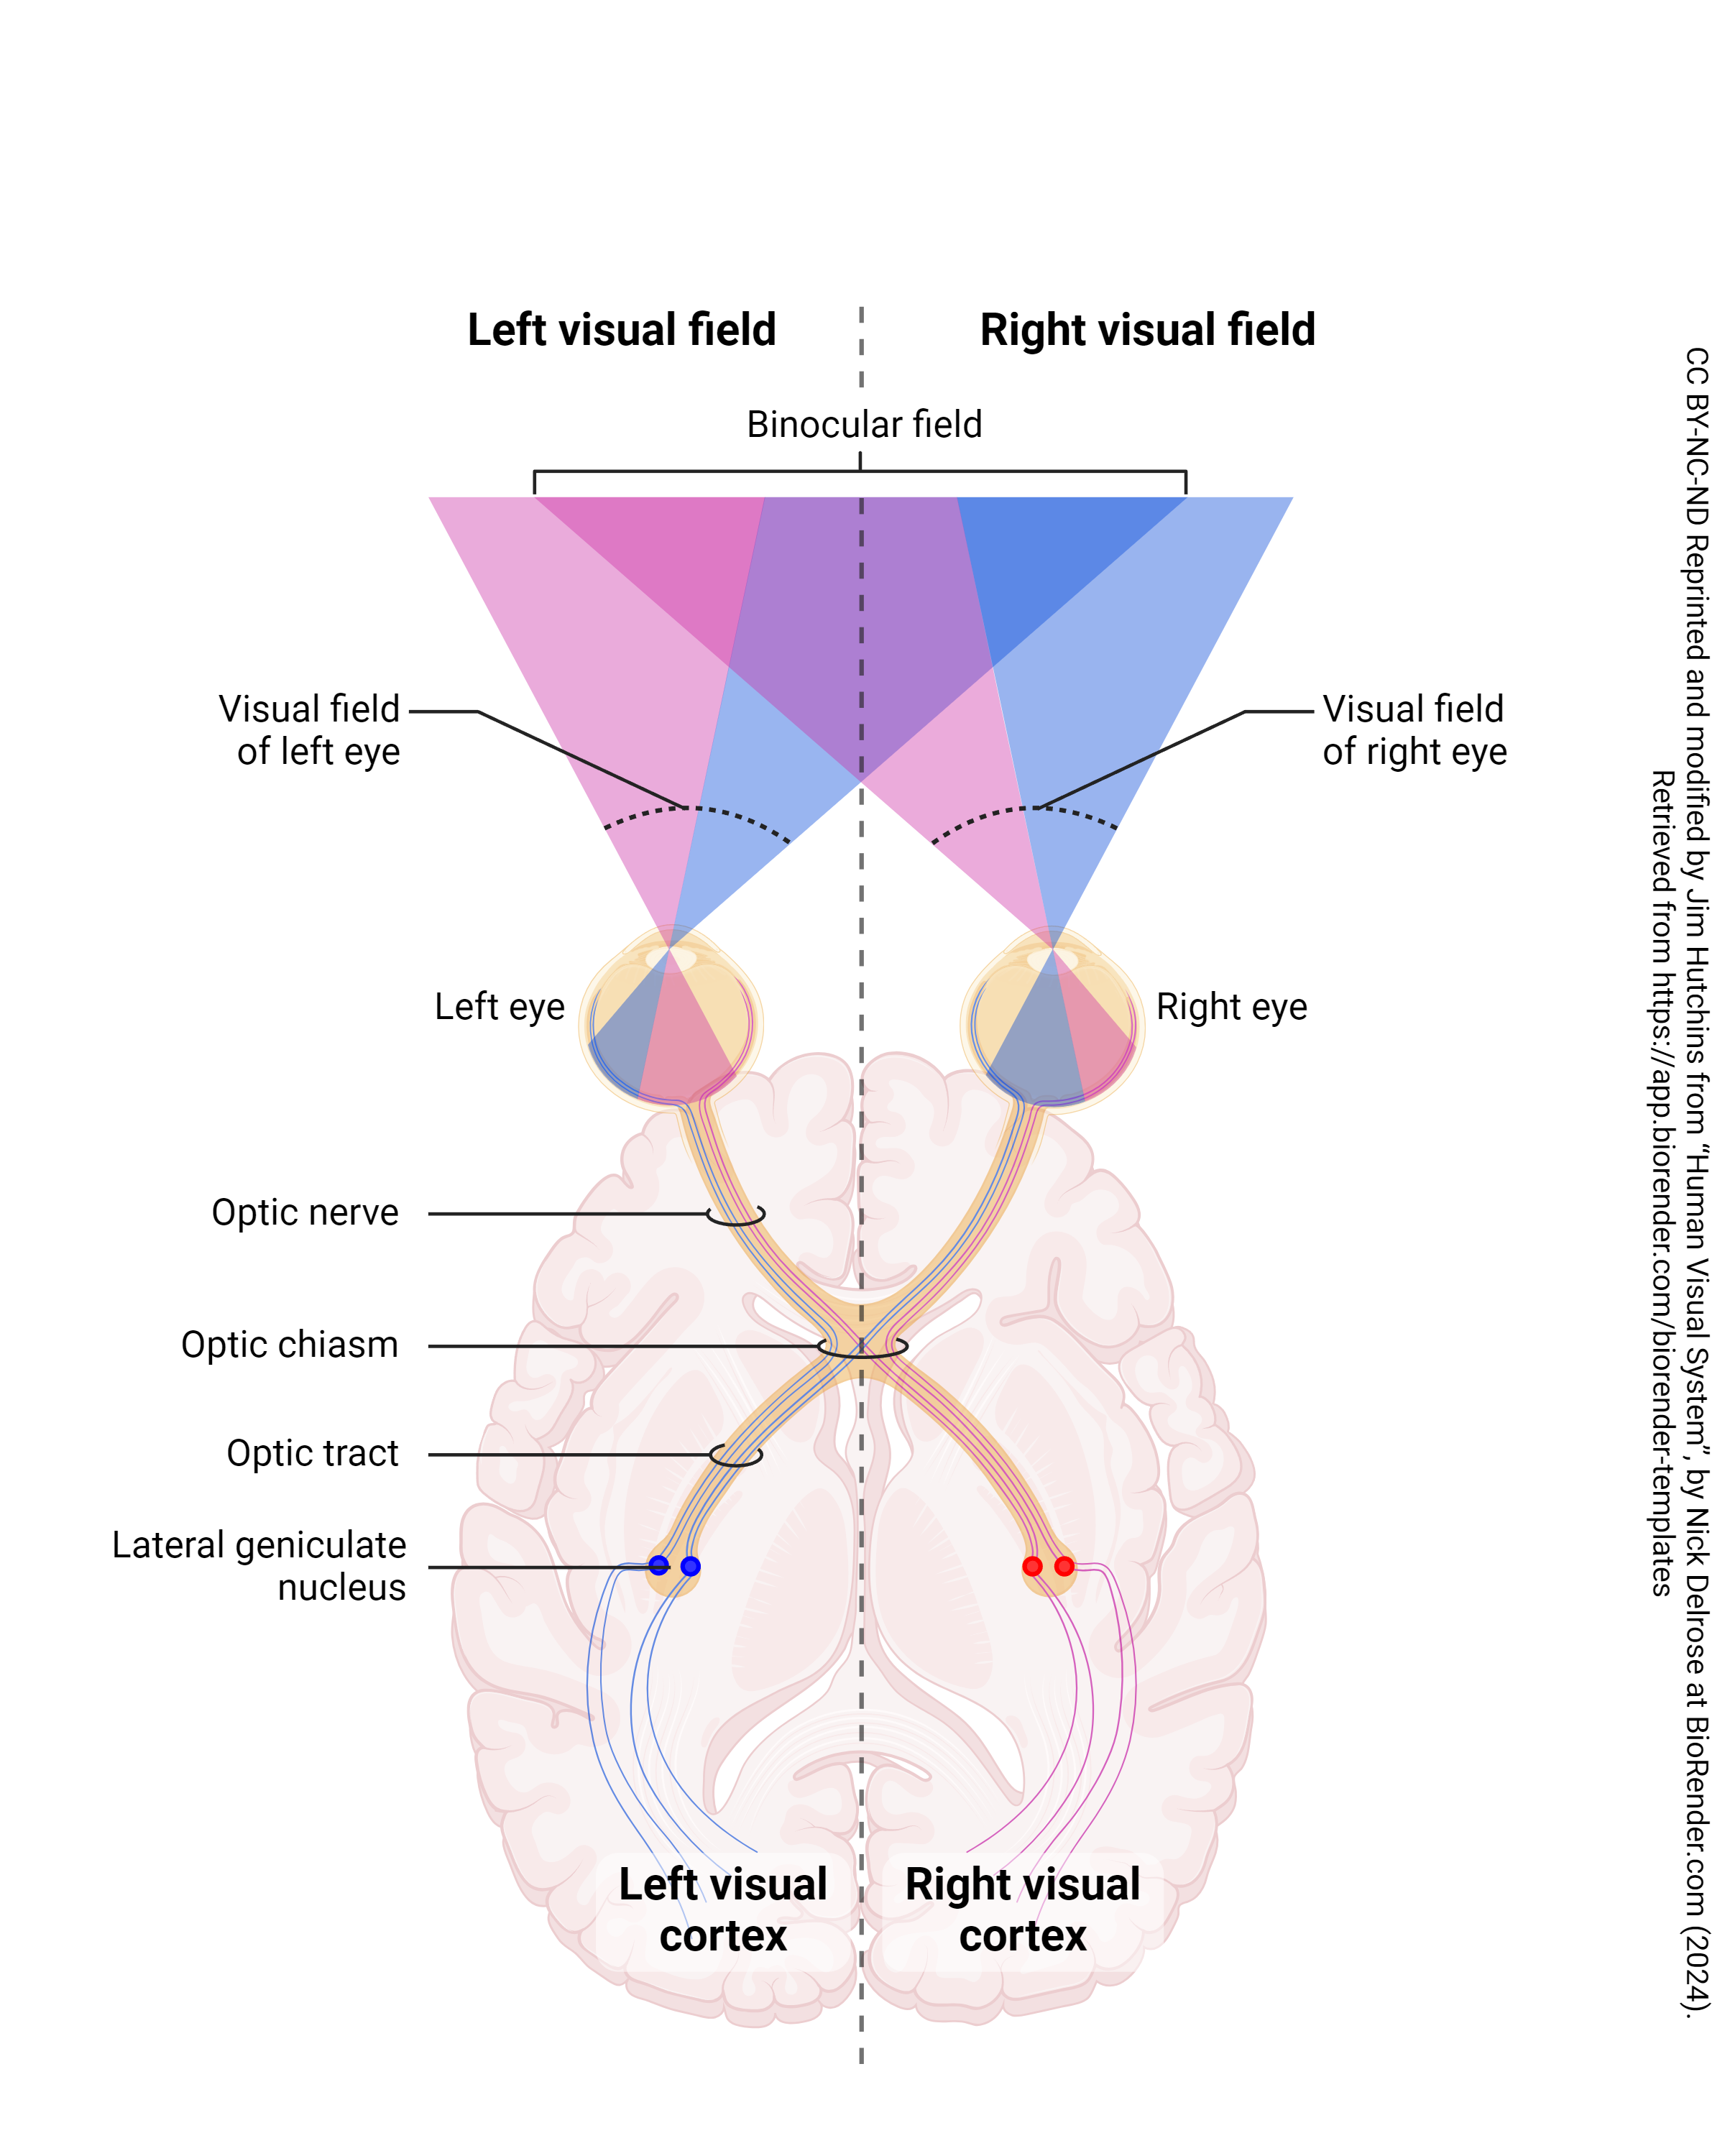
Neurological Lesions
| Lesion Site | Visual Field Defect |
|---|---|
| Optic Chiasm | Bitemporal hemianopia |
| Optic Tract | Incongruous homonymous hemianopia |
| Meyer’s Loop (Temporal Lobe) | Superior quadrantanopia (“pie in the sky”) |
| Parietal Lobe | Inferior quadrantanopia (“pie on the floor”) |
| Occipital Lobe | Congruous homonymous hemianopia with possible macular sparing |
These patterns are diagnostic clues in stroke, tumors, and traumatic brain injury.
Final Note
The normal monocular visual field spans approximately 150° horizontally (100° temporal, 60° nasal) and 120° vertically (60° superior, 70° inferior). This range is foundational for clinical evaluation, disease monitoring, and functional assessments like driving. The physiological blind spot at 15° temporal and 1.5° below is a normal finding but crucial for test validity.
Visual field testing—via Goldmann, Humphrey, or Esterman protocols—provides objective data on vision loss. Interpreting results requires understanding reliability indices, isopter patterns, and neurological correlations.
Whether you’re a clinician interpreting perimetry reports or a patient navigating vision loss, knowing what’s normal—and what’s not—in monocular visual field degrees empowers better outcomes. Regular testing is vital for early detection of glaucoma, neurological disorders, and retinal diseases, preserving both vision and independence.