Counting white blood cells (WBCs) under a microscope is a vital skill in clinical hematology, used to assess immune status and diagnose conditions like infection, inflammation, leukemia, and immune disorders. While automated analyzers provide fast, precise results in most cases, manual WBC counting remains essential when automated systems fail—such as with clotted samples, abnormal cell morphology, or low cell counts. This method not only delivers quantitative data but also allows for detailed morphological evaluation that machines often miss.
You’ll learn how to prepare a high-quality blood smear, stain it properly with Wright’s method, estimate total WBC count from the slide, perform an accurate differential count, correct for nucleated red blood cells (nRBCs), and interpret findings in clinical context. Whether you’re a medical student, lab technician, or clinician, mastering this technique ensures reliable results when automated methods fall short.
Prepare a High-Quality Blood Smear
A well-made smear is the foundation of accurate microscopic analysis, ensuring even cell distribution and clear visualization.
Use Correct Finger Puncture and Spreading Technique
- Select the puncture site: Use the middle or ring finger for capillary blood collection.
- Cleanse and dry: Wipe the fingertip with alcohol and allow it to air-dry completely to avoid hemolysis.
- Puncture the skin: Use a sterile lancet to make a quick, firm puncture on the fingertip pad.
- Discard the first drop: This removes tissue fluid contamination; use the second drop for the smear.
- Apply blood to slide: Touch a clean glass slide to the emerging blood drop to collect a small, 1–2 mm diameter sample.
- Spread using a spreader slide:
– Place a second slide at a 30–45° angle in front of the blood drop.
– Let capillary action draw the blood along the edge.
– Push forward smoothly and steadily to create a feathered edge with a gradual taper.
Ensure Even Cell Distribution in the Monolayer
The monolayer—just before the feathered edge—is where red and white blood cells are spread singly and non-overlapping, ideal for counting and identification.
- Avoid thick areas where cells pile up or thin zones with no cells.
- Air-dry the slide completely; never blot or heat-fix, as this distorts cell shape and staining.
- Poor technique leads to cell clumping, gaps, or uneven distribution, which skews counts and misleads interpretation.
A high-quality smear should have a smooth gradient from thick to thin, ending in a clean feathered edge with no hazy streaks or bumps.
Stain the Slide with Modified Wright’s Method

Proper staining reveals critical nuclear and cytoplasmic details needed to distinguish WBC types.
Apply Wright’s Stain Using Exact Timing
Modified Wright’s stain uses eosin Y and methylene blue to differentiate cellular components:
- Eosin Y stains cytoplasm pink/orange
- Methylene blue stains nuclei blue
- Granules appear as follows:
- Eosinophils: bright red-orange
- Basophils: dark purple-black
- Neutrophils: fine lilac granules
Follow the Standardized Staining Protocol
- Immerse the dried smear in Wright’s stain for exactly 30 seconds.
- Transfer to the first beaker of distilled water for 45 seconds.
- Move to the second beaker of distilled water for 25 seconds.
- Do not rinse between steps, as this washes away the stain.
- Let the slide air-dry upright; never blot or wipe.
A well-stained slide shows:
– Clear, detailed nuclear chromatin patterns
– Distinct granule coloration
– Pale pink red blood cells evenly dispersed
Under-staining reduces contrast, making cells hard to distinguish. Over-staining darkens the background and obscures fine details, increasing misclassification risk.
Estimate Total WBC Count from the Blood Smear
When no automated count is available, a microscopic estimate provides a rough approximation.
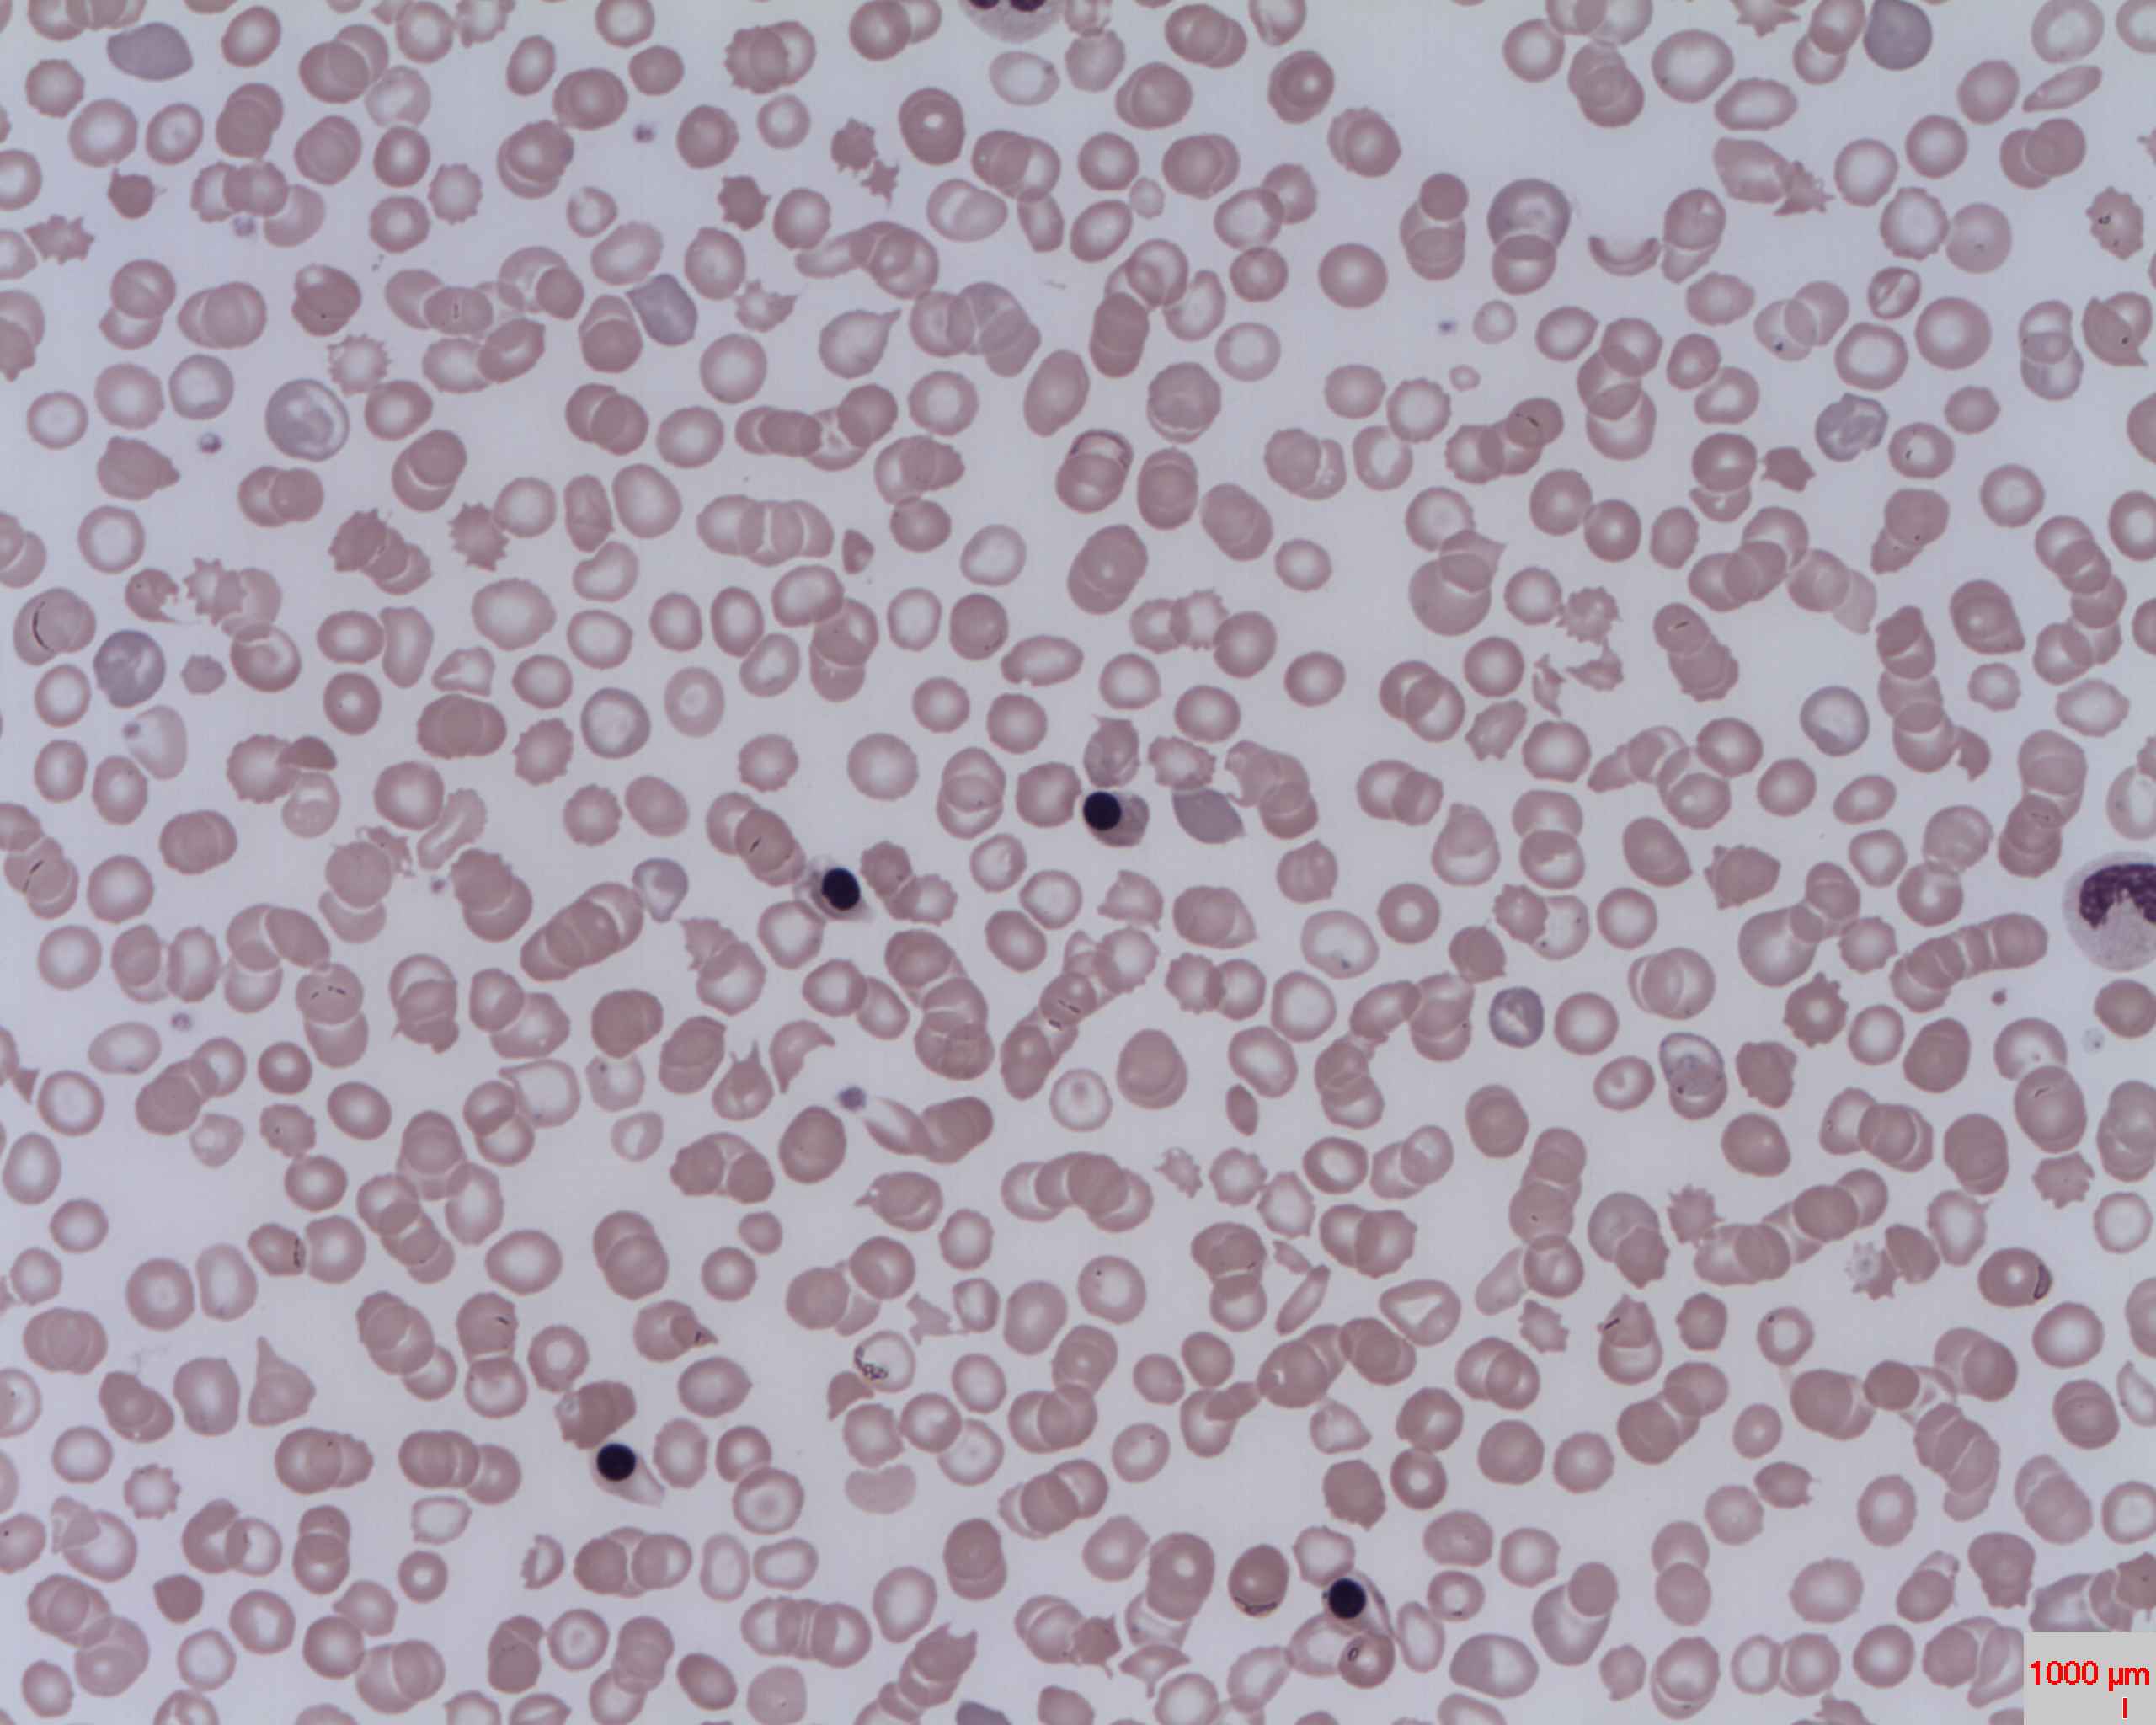
Count WBCs at 400x Magnification in the Monolayer
- Switch to the 40x objective lens with a 10x eyepiece (400x total magnification).
- Focus on the monolayer region where cells are evenly spread.
- Count the number of WBCs in 10 consecutive fields.
- Calculate the average number of WBCs per field.
Apply the Smear Estimation Rule
1 WBC per field ≈ 2,500–3,100 WBC/µL
For example:
– Average of 6 WBCs per field ≈ 15,000–18,600/µL
– Average of 2 WBCs per field ≈ 5,000–6,200/µL
Important limitations:
– Accuracy depends on smear thickness, blood viscosity, and even spreading
– Less reliable than automated counts
– Only use when formal WBC count is unavailable
Always label such estimates as “smear estimate” in patient reports to avoid misinterpretation.
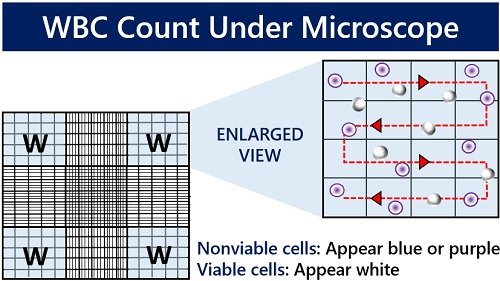
Perform a Differential WBC Count Using the Battlement Method
This determines the percentage of each WBC type present in circulation.
Scan in a Systematic Zig-Zag Pattern
- Start at low power (10x objective) to locate the monolayer.
- Switch to oil immersion (100x objective, 1000x total magnification).
- Move the slide in a “battlement” or zig-zag pattern, covering the monolayer systematically.
- Avoid the feathered edge and thick end, where WBCs concentrate and skew results.
Count and Classify 100 White Blood Cells
Tally each cell into one of these categories:
– Neutrophils (segmented and bands)
– Lymphocytes
– Monocytes
– Eosinophils
– Basophils
– Other (blasts, reactive lymphs, mast cells)
Standard practice: Count 100 cells for reliable percentages. Some labs accept 50 for screening, but 100 improves statistical accuracy.
| Cell Type | Normal Percentage Range |
|---|---|
| Neutrophils | 55–65% |
| Lymphocytes | 25–33% |
| Monocytes | 3–7% |
| Eosinophils | 1–3% |
| Basophils | <0.2% |
Calculate percentages using:
(Number of cell type ÷ 100) × 100 = %
Convert Percentages to Absolute WBC Counts
Relative percentages can be misleading—always calculate absolute values for accurate diagnosis.
Use the Absolute Count Formula
Absolute count (cells/µL) = (Percentage ÷ 100) × Total WBC count
Example:
- Total WBC = 18,000/µL
- Lymphocytes = 40%
- Absolute lymphocyte count = 0.40 × 18,000 = 7,200/µL
Even though 40% may seem high, if the total WBC is elevated, this reflects true lymphocytosis. Conversely, a high percentage with a low total WBC may be normal.
Clinical impact: Absolute counts reveal whether a change is real or relative, guiding decisions in infection, leukemia, and immune disorders.
Correct WBC Count for Nucleated Red Blood Cells
nRBCs are mistaken for WBCs in both manual and automated counts, inflating results.
Know When to Apply Correction
- If you observe >5 nRBCs per 100 WBCs during the differential count
- Common in neonates, severe anemia, leukemia, or bone marrow stress
Apply the Correction Formula
Corrected WBC = Observed WBC × [100 ÷ (nRBC + 100)]
Example:
- Observed WBC = 22,000/µL
- nRBCs counted = 12 per 100 WBCs
- Corrected WBC = 22,000 × (100 ÷ 112) = 19,643/µL
Failure to correct leads to falsely elevated WBC, potentially resulting in unnecessary tests or misdiagnosis.
Identify WBCs by Morphological Features
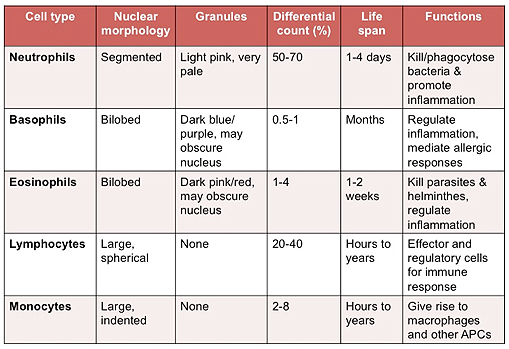
Accurate classification depends on recognizing key visual characteristics under oil immersion.
Compare Key Identification Criteria
| Cell Type | Nucleus Shape | Cytoplasm | Granules | Size (µm) |
|---|---|---|---|---|
| Neutrophil | Segmented (2–5 lobes) | Pale pink | Fine, lilac | 10–14 |
| Lymphocyte | Round, dense chromatin | Scant, blue | None/few | 7–15 |
| Monocyte | Folded, bean-shaped | Gray-blue, abundant | Dusty, fine | 12–20 |
| Eosinophil | Bilobed | Clear | Large, red-orange | 12–17 |
| Basophil | S-shaped, obscured | Blue-gray | Dark purple-black | 10–14 |
Critical distinctions:
– Band vs. segmented neutrophil: Band has U-shaped nucleus without clear segmentation.
– Monocyte vs. large lymphocyte: Monocytes have more cytoplasm and finer chromatin.
– Reactive lymphocyte: Larger size, irregular nucleus, seen in viral infections.
Regular practice improves recognition and reduces misclassification.
Avoid Common Technical Errors and Artifacts
Even experienced technicians can make mistakes without strict adherence to protocol.
Prevent Sampling and Identification Errors
- Poor smear quality: Causes overlapping or absent cells
- Staining issues: Under- or over-staining reduces accuracy
- Sampling bias: Only counting easy fields leads to skewed results
- Misidentification: Especially between monocytes, blasts, and atypical lymphs
Recognize Common Artifacts
- Platelet clumps: Trap WBCs, leading to undercount
- Cryoglobulins: Cause cell clumping and false low counts
- Heinz bodies (in cats): Interfere with automated counts
- Fragile lymphocytes (in CLL): Lyse during smear prep, causing falsely low counts
Always verify automated flags with manual review.
Interpret WBC Results in Clinical Context
Numbers alone are not enough—results must be correlated with patient history and symptoms.
Recognize Patterns of Leukocytosis
| Cell Increase | Likely Causes |
|---|---|
| Neutrophilia | Bacterial infection, inflammation |
| Lymphocytosis | Viral infection, CLL |
| Eosinophilia | Allergy, parasitic infection |
| Monocytosis | Chronic inflammation |
| Basophilia | Myeloproliferative disorders |
Detect Clues of Leukopenia
- Neutropenia with left shift: Severe infection
- Lymphopenia: Stress, corticosteroid use
- Toxic neutrophils: Bone marrow stress
- Pancytopenia: Marrow failure, leukemia
Golden rule: Always calculate absolute counts before interpreting. A high percentage may simply reflect a low total WBC.
Compare Manual and Automated WBC Counting Methods
Each method has strengths and limitations.
Manual Counting: Best for Morphology and Problem Solving
| Pros | Cons |
|---|---|
| Detects abnormal cells | Time-consuming |
| Assesses morphology | Human error risk |
| Works on clotted samples | Lower precision |
| Low equipment cost | Not high-throughput |
Ideal for CSF, synovial fluid, and verification of abnormal automated results.
Automated Counting: Fast and Precise, But Blind to Morphology
| Pros | Cons |
|---|---|
| Fast, high-throughput | Misses cell shape |
| Accurate for normal cells | Fails with clots, cryoglobulins |
| Provides absolute counts | Misreads platelet clumps as WBCs |
Common analyzers: Coulter Z2, ADVIA 2120, Sysmex XN-9000.
Best practice: Use automation for routine work, manual for confirmation.
Follow Best Practices for Reliable Manual WBC Counts
Accuracy comes from consistency, attention to detail, and proper technique.
Key Steps to Ensure Quality Results
- Prepare a clean, even smear using correct angle and speed.
- Stain with Wright’s method using exact timing—no rinsing.
- Air-dry fully—no blotting or heat.
- Scan at 10x to find the monolayer.
- Count 100 WBCs at 1000x using a battlement pattern.
- Calculate percentages, then absolute counts.
- Correct for nRBCs if >5 per 100 WBCs.
- Estimate total WBC only when necessary.
- Correlate with clinical picture.
- Verify abnormal automated results manually.
Manual WBC counting remains an indispensable tool in hematology. Despite advances in automation, the human eye still detects what machines cannot—abnormal shapes, toxic changes, and rare cells that signal serious disease. By following standardized techniques, avoiding common pitfalls, and interpreting results in context, you ensure accurate, actionable data for diagnosis and treatment. Practice regularly, double-check your work, and always trust the smear when numbers don’t match the patient.